- / -
EMSC3025/6025: Remote Sensing of Water Resources
Dr. Sia Ghelichkhan
- / -
Unsaturated Flow and Miscellaneous Groundwater Topics
EMSC3025/6025
Dr. Sia Ghelichkhan
Objectives
By the end of this lecture, you should be able to:
- Define volumetric water content
\theta and water saturations in the vadose zone. - Explain why pressure head
\psi is negative in the unsaturated zone. - Describe methods for measuring water content (gravimetric and indirect techniques).
- Understand infiltration, redistribution, and recharge processes in unsaturated flow.
- Explain characteristic curves: water retention
\theta(\psi) and hydraulic conductivityK(\psi) . - Recognize key soil water models (Brooks-Corey, van Genuchten) and their applications.
- Apply the cubic law for flow in fractured media and calculate fracture hydraulic conductivity.
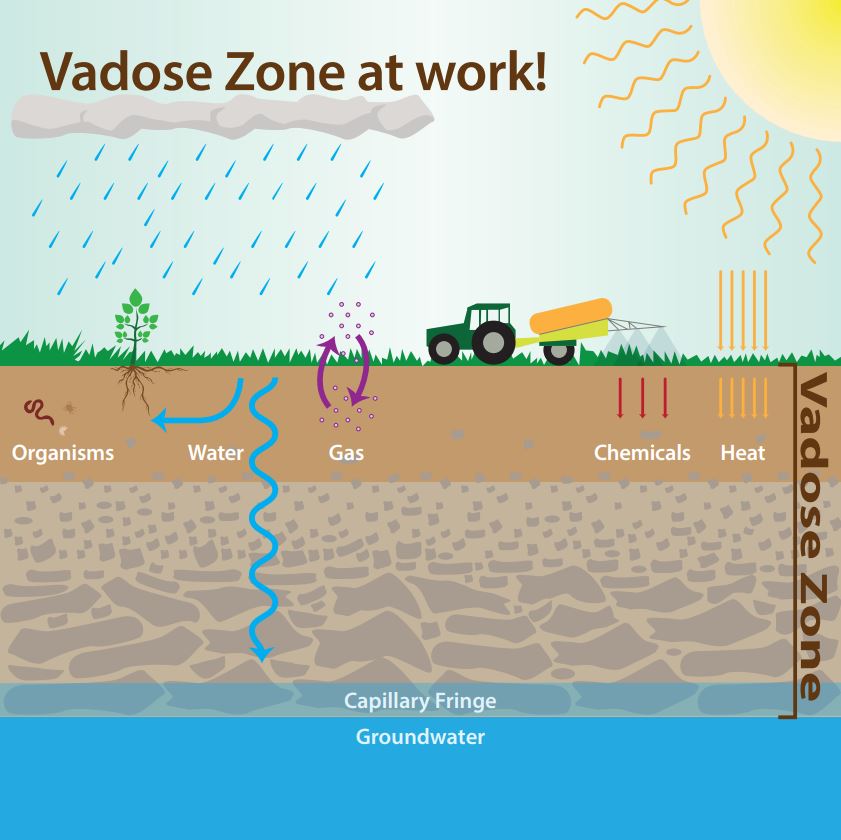
Unsaturated or vadose zone
The space between the water table and the ground surface is called the vadose zone.
- The flow of water in the unsaturated zone is complicated.
- The the pore spaces contain both soil gas and water.
- Hydraulic constants, such as conductivity and diffusion, become hydraulic functions.
- The transmissive/storage properties can change dramatically depending on the water content.
Vadose zone essentials
In the unsaturated (vadose) zone, pores contain both soil gas and water. Two core descriptors:
- Volumetric water content:
- Water saturation:
Key point
In the unsaturated zone, typically
Measuring water content
- For a direct measurement of water content
\theta_w as a weight fraction:- Weight the soil in a covered container.
- Dry it in a convection oven for 24 hours.
- Weight it again.
\theta_w = \frac{W_{wet - soil}}{W_{dry - soil}} -1 Volumetric water content:
\theta = \theta_w \,\dfrac{\rho_b}{\rho_w}
Indirect methods: measuring properties associated with water content.
- Electrical conductivity: Measuring the electrical resistivity of the soil: dependendent on water content.
- Time-domain reflectometry: Measuring dielectric constant of the soil: dependent on water content.
- gamma-ray attenuation: Water absorbs more gamma rays than soil.
Hydraulic head in the unsaturated zone
Hydraulic head: determines the direction of fluid flow.
It combines elevation and pressure:
- Above the water table:
\psi < 0 (suction/tension). Water pressure less than atmospheric pressure. Explains why water in unsaturated zon does not flow to a borehole. - At the water table:
\psi = 0 . - Below the water table (saturated):
\psi > 0 .

Measuring negative pressure head — Tensiometer
Tensiometer (ASTM 1992; Stannard 1986):
- Porous ceramic cup connected to a water column/manometer, vacuum gauge, or pressure transducer.
- Cup is water-filled → provides hydraulic connection to pore water.
- As soil water pressure changes, instrument records
\psi (negative) to maintain equilibrium.
Interpreting head profiles
From the text example:
- Pressure head
\psi : negative above the water table, positive below. - Total head
h = z + \psi : decreases with depth through the unsaturated zone → downward flow.
The process of infiltration is complex
Consider the process of infiltration precipitation in unsaturated soil!
Changes in Moisture Content During Infiltration
- Water content in the unsaturated zone varies with space and time.
- At early times → capillary forces dominate, increasing water content near the surface.
- Later → infiltration ceases, and water redistributes downward.
- Both capillary and gravitational forces act.
- A wetting front forms: narrow zone where water content sharply increases.

Redistribution After Infiltration
- After infiltration stops, the infiltrated pulse moves downward.
- The wetting front is clearly visible.
- Soil above the front gradually dries, while water below remains at higher content.
- This redistribution continues until equilibrium is reached or evapotranspiration intervenes.
Final Stage of Moisture Movement
- Near the surface, evapotranspiration removes water once infiltration ends.
- Eventually, infiltrated water reaches the saturated zone.
- The unsaturated zone returns toward its initial condition, with soil moisture gradually reduced.
- Figure illustrates soil water entering saturated regions.
Characteristic Curves in the Unsaturated Zone
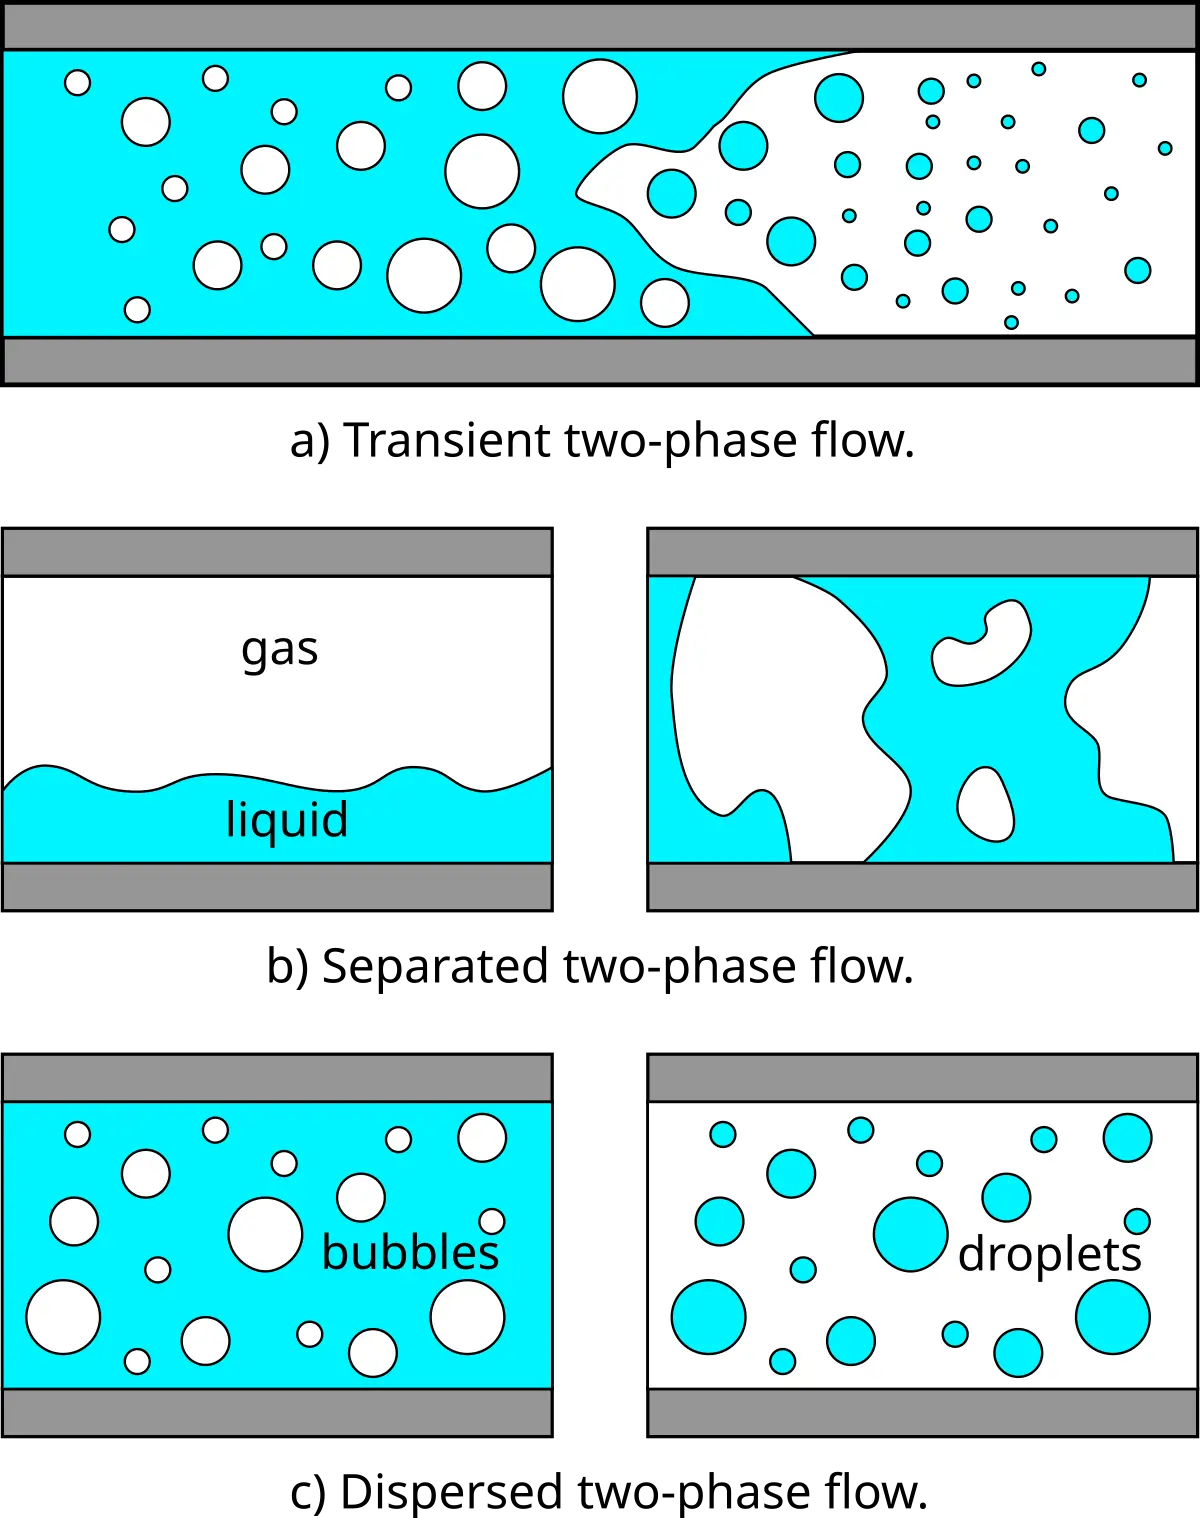
- In unsaturated media, flow is complex due to two-phase flow (air + water).
- Both volumetric moisture content (
\theta ) and hydraulic conductivity (K ) depend on water content. - The pressure head/moisture content relationship describes how a sample behaves as water is added or removed.
- As soil dries, void spaces fill with air → harder for water to flow.
Key insight
Hydraulic constants become hydraulic functions in the unsaturated zone.
Water Retention (\theta(\psi) ) Curves
Water Retention Curve: Relationship between negative pressure head and volumetric water content.
- As
\theta decreases →\psi becomes more negative → capillary pressure increases. \theta is always on arithmetic scale, while pressure could be on log scale.- Curves are nonlinear regardless of scaling.
- At extremes: small variation in
\theta results in big variation in\psi . - Minimum
\theta approaches residual volumetric water content\theta_r .

Effective Saturation
To develop mathematical relationships, researchers measure different soil behaviors in the lab and fit equations to the data.
Effective saturation normalizes water content to be independent of soil type:
where:
s_e = effective saturation (0 to 1)\theta_r = residual volumetric water contentn = porosity (maximum\theta can be)
Two commonly used models:
- Brooks-Corey relationship
- van Genuchten equations
Both are written in terms of effective saturation
Brooks-Corey Water Retention Model
Brooks–Corey equation defines effective saturation as:
Parameters:
\psi_b = bubbling or air-entry pressure head [L]- Pressure head at which air bubbles start entering the medium
- Pressure needed to desaturate the largest pores in the medium
\lambda = pore-size distribution index (dimensionless)

van Genuchten Water Retention Model
van Genuchten equation is expressed as:
Parameters:
\alpha = scaling parameter [1/L]\beta = curve shape exponent (dimensionless)\gamma = 1 - \dfrac{1}{\beta} (constraint for van Genuchten)

Hysteresis and Soil Type Effects
Hysteresis: The actual behavior depends on whether air is entering (drying phase) or water is entering (wetting phase).
- Drying → air enters pores, displaces water
- Wetting → water enters, displaces air
- Shape is slightly different for each process
Soil type impact depends on pore-size distribution:
- Sand → uniform, large pores → sharp curves
- Fine sand → intermediate behavior
- Silt loam → broad pore size distribution → gradual curves, higher
\theta at same\psi

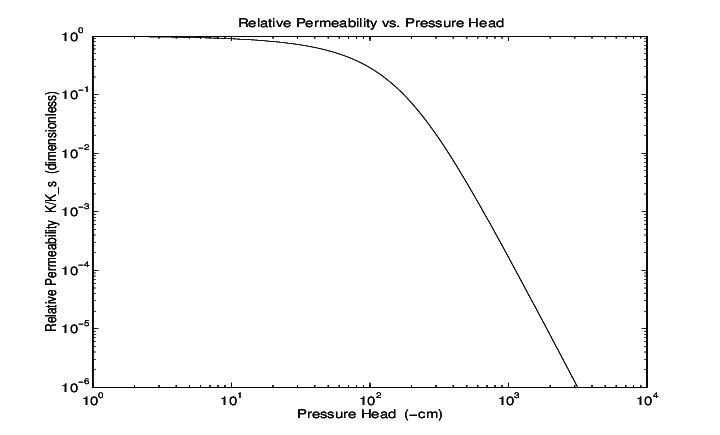
K(\psi) Curves – Unsaturated Hydraulic Conductivity
As expected, for unsaturated media
- As water content approaches zero → negative hydraulic pressure increases more and more.
- Close to residual volumetric content
\theta_r → hydraulic conductivity becomes practically zero. - Near saturation (
\psi \approx 0 ) →K \approx maximum value.
Key insight
As soil dries, void spaces fill with air, making it harder for water to flow.
Relative Hydraulic Conductivity
To capture this behavior, we introduce the concept of relative hydraulic conductivity or permeability.
This shows us the ratio with respect to the saturation property:
where:
K_r = relative hydraulic conductivity (0 to 1)K(\psi) = unsaturated hydraulic conductivityK_s = saturated hydraulic conductivity
Purpose:
Shows the fraction of saturated conductivity available at any given pressure head.
Brooks–Corey Model for K(\psi)
Going with the same line of thought, the hydraulic conductivity can be written in terms of the negative pressure head:
Parameters:
\psi_b = bubbling (air-entry) pressure head\lambda = pore-size distribution index
 model curves")
van Genuchten Model for K(\psi)
In the same way, we can describe the van Genuchten relationship as:
Parameters:
\alpha = scaling parameter [1/L]\beta = curve steepness parameter\gamma = 1 - \dfrac{1}{\beta} (van Genuchten constraint)
Alternative form in terms of
with
Moisture Capacity C(\psi) Curves
The storage properties of an unsaturated soil can be represented by a parameter called specific moisture capacity
Moisture, capillary or differential water capacity is the slope of the water retention curve.
This is basically the derivative of water content with respect to pressure.
")
Physical meaning: Shows how much
Models for Moisture Capacity
Brooks–Corey model:
van Genuchten model:

Summary: Characteristic Curves
Three fundamental relationships describe unsaturated flow:
- Water Retention Curve
\theta(\psi) : How soil holds/releases water as pressure changes - Hydraulic Conductivity Curve
K(\psi) : How flow capacity varies with water content - Moisture Capacity Curve
C(\psi) : How storage properties change with pressure
Key models:
- Brooks-Corey: Uses bubbling pressure
\psi_b and pore-size distribution\lambda - van Genuchten: Uses scaling parameter
\alpha , shape parameter\beta , and constraint\gamma = 1 - 1/\beta
All relationships are strongly nonlinear and depend on soil type and pore-size distribution.
Flow Equation in the Unsaturated Zone
Darcy’s law (unsaturated form):
K(\psi) : unsaturated conductivityh : hydraulic head
Relative conductivity form:
K_r : relative conductivity (0–1)K_s : saturated conductivity
Conservation in the Unsaturated Zone
Combining Darcy + conservation of mass:
- General tensor form with
K_{ij} . - Inflow – outflow = storage change.
- Equivalent to Richards’ equation for unsaturated flow.
Modified Richards’ Equation
The equation can be rewritten with moisture capacity and specific storage:
c_m : moisture capacitys : saturationS_s : specific storage
One-Dimensional Case
For vertical flow (
- Includes both pressure gradient and gravity term (+1).
- Common in infiltration models.
Check-in: How is this similar/different to saturated flow equation?
Velocity in Unsaturated Flow
Linear groundwater (pore water) velocity:
q : Darcy velocity\theta : volumetric water contents : saturation,n : porosity
Practice check:
Why does dividing by