- / -
EMSC3025/6025: Remote Sensing of Water Resources
Dr. Sia Ghelichkhan
- / -

Groundwater -- Principles
EMSC3025/6025
Dr. Sia Ghelichkhan
Objectives
By the end of this module, you will be able to:
- Understand porosity: Calculate and interpret porosity in different geological materials
- Apply Darcy’s Law: Use the fundamental equation to analyze groundwater flow
- Measure hydraulic properties: Distinguish between hydraulic head, conductivity, and permeability
- Analyze flow systems: Interpret flow patterns in heterogeneous and anisotropic media
- Use field methods: Design monitoring networks using wells and piezometers
- Create flow maps: Construct potentiometric surfaces and interpret hydrographs
- Solve practical problems: Apply groundwater principles to real-world scenarios
Groundwater Flow Theory
- This module introduces the principal laws that govern groundwater movement through porous media.
- We will explore:
- Definitions and significance of porosity
- Darcy’s Law: the foundational equation for flow in saturated zones.
- Concepts of hydraulic head, conductivity, and velocity
- These principles form the basis for:
- Understanding aquifer behavior
- Designing wells and evaluating sustainability
- Developing numerical models
Porosity of a Soil or Rock
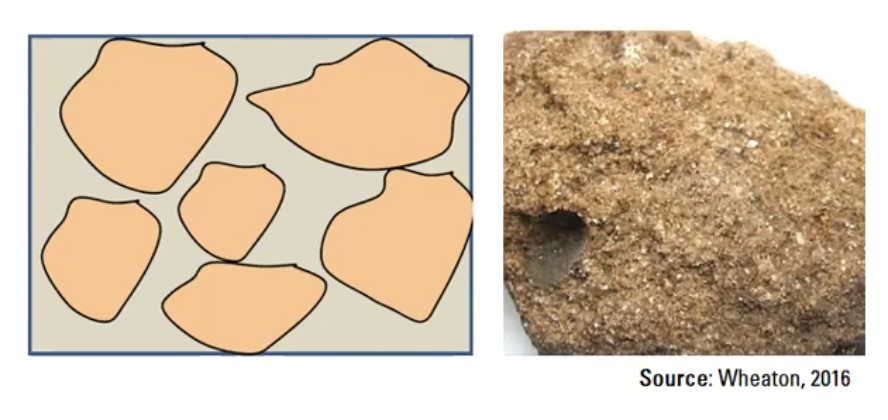
- Porosity describes how much void space exists in a rock or soil—essentially, how much room is available to hold water.
- Groundwater resides in the pores of rocks and sediments.
- Total porosity
n_T is defined as:n_T = \frac{V_v}{V_T} = \frac{V_T - V_s}{V_T} where:V_v = volume of voidsV_s = volume of solidsV_T = total volume
- Typical values of
n_T :- Sand and gravel: 0.25 – 0.35
- Cemented sandstones: 0.05 – 0.15
Porosity and Bulk Density
- Porosity can also be calculated using bulk density:
n_T = 1 - \frac{\rho_b}{\rho_s} where:\rho_b = bulk density (mass/volume of dry sample)\rho_s = particle density (mass/volume of solids)
- This approach is common in lab settings where volume and mass can be measured directly.
It is also useful to distinguish:
- Primary porosity: original voids formed during rock/soil formation (e.g., in sediments, vesicles in lava).
- Secondary porosity: formed later, e.g., via fractures, faults, or dissolution in carbonates.
Factors Affecting Porosity
- Primary porosity depends on:
- Compaction: tighter packing = lower porosity
- Grain shape and arrangement: more spherical = less compact = higher porosity
- Sorting:
- Well-sorted sediments (uniform size) → higher porosity
- Poorly sorted (mixed sizes) → smaller grains fill the voids
- Porosity ranges:
- 0 to >50% depending on material
- Unlithified materials (e.g. sand) >> lithified ones (e.g. sandstone)
Good sorting and less compaction = more room for groundwater.

Porosity in Natural Materials
- For unlithified materials:
- Smaller grain size → higher porosity (e.g. clays > sands)
- Glacial till is variable (mixtures of sand/silt/clay + varying compaction)
- Sandstone:
- Porosity reduced by cementation
- Carbonates (e.g., limestone, dolomite):
- Diagenesis and reactivity make porosity highly variable
- Igneous rocks: low primary porosity
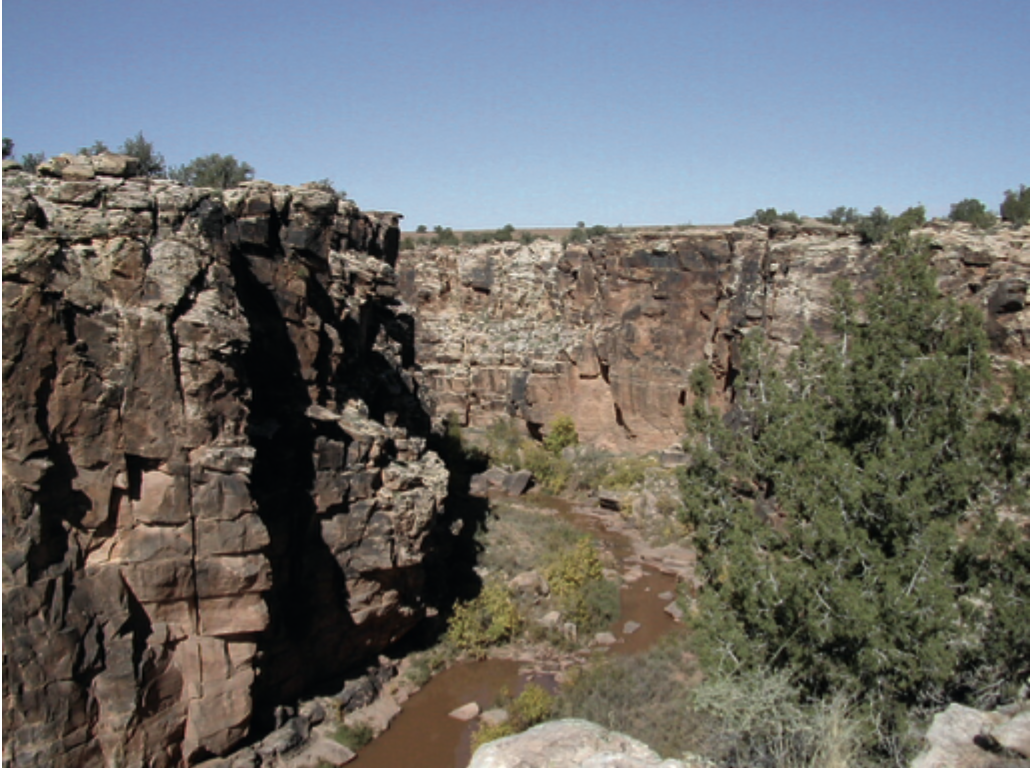
- Fractured rocks:
- Have dual porosity: matrix + fractures
- Fractures provide secondary porosity essential for flow

Never judge porosity by rock type alone—structure and history matter.
Effective Porosity and Dual Porosity Systems
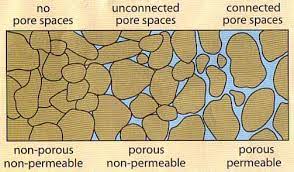
- Effective porosity: fraction of pore space that actually contributes to flow
- Often < total porosity (Not all the pores are connected)
- Especially important in fractured or poorly connected media
- Fractured media (e.g. shales, granite):
- Matrix may store water, but fractures control flow
- Fracture porosity $n_f$ for shale: ~0.05 or less
- Dual porosity systems:
- Primary: matrix porosity
- Secondary: fractures, dissolution features (e.g. caverns in limestone)
- Porosity must be paired with permeability (up next!) to understand flow.
Range of Porosity values
| Material | Min | Mean | Max | SD |
|---|---|---|---|---|
| Unlithified deposits | ||||
| Sand | 28.1 | 38.9 | 44.4 | 4.9 |
| Dune | c | 42.1 | c | 8.3 |
| Silt | 31.5 | 45.2 | 50.8 | 5.6 |
| Clay | 40.1 | 46.1 | 55 | 4.5 |
| Glacial till | 14.3 | 23.5 | 34 | c |
| Peat | c | 92 | c | c |
| Material | Min | Mean | Max | SD |
|---|---|---|---|---|
| Sedimentary rocks | ||||
| Sandstone | 4 | 20.4 | 28.6 | 8.6 |
| Limestone | 0.44 | 8.67 | 34.7 | 8.6 |
| Dolostone | 0.4 | 7.46 | 26 | c |
| Shale | 0.75 | 10.8 | 27.2 | 8.3 |
| Igneous rocks | ||||
| Granite | <0.001 | 0.01 | ||
| Basalt | <0.01 | 0.1 |
Occurrence of Groundwater
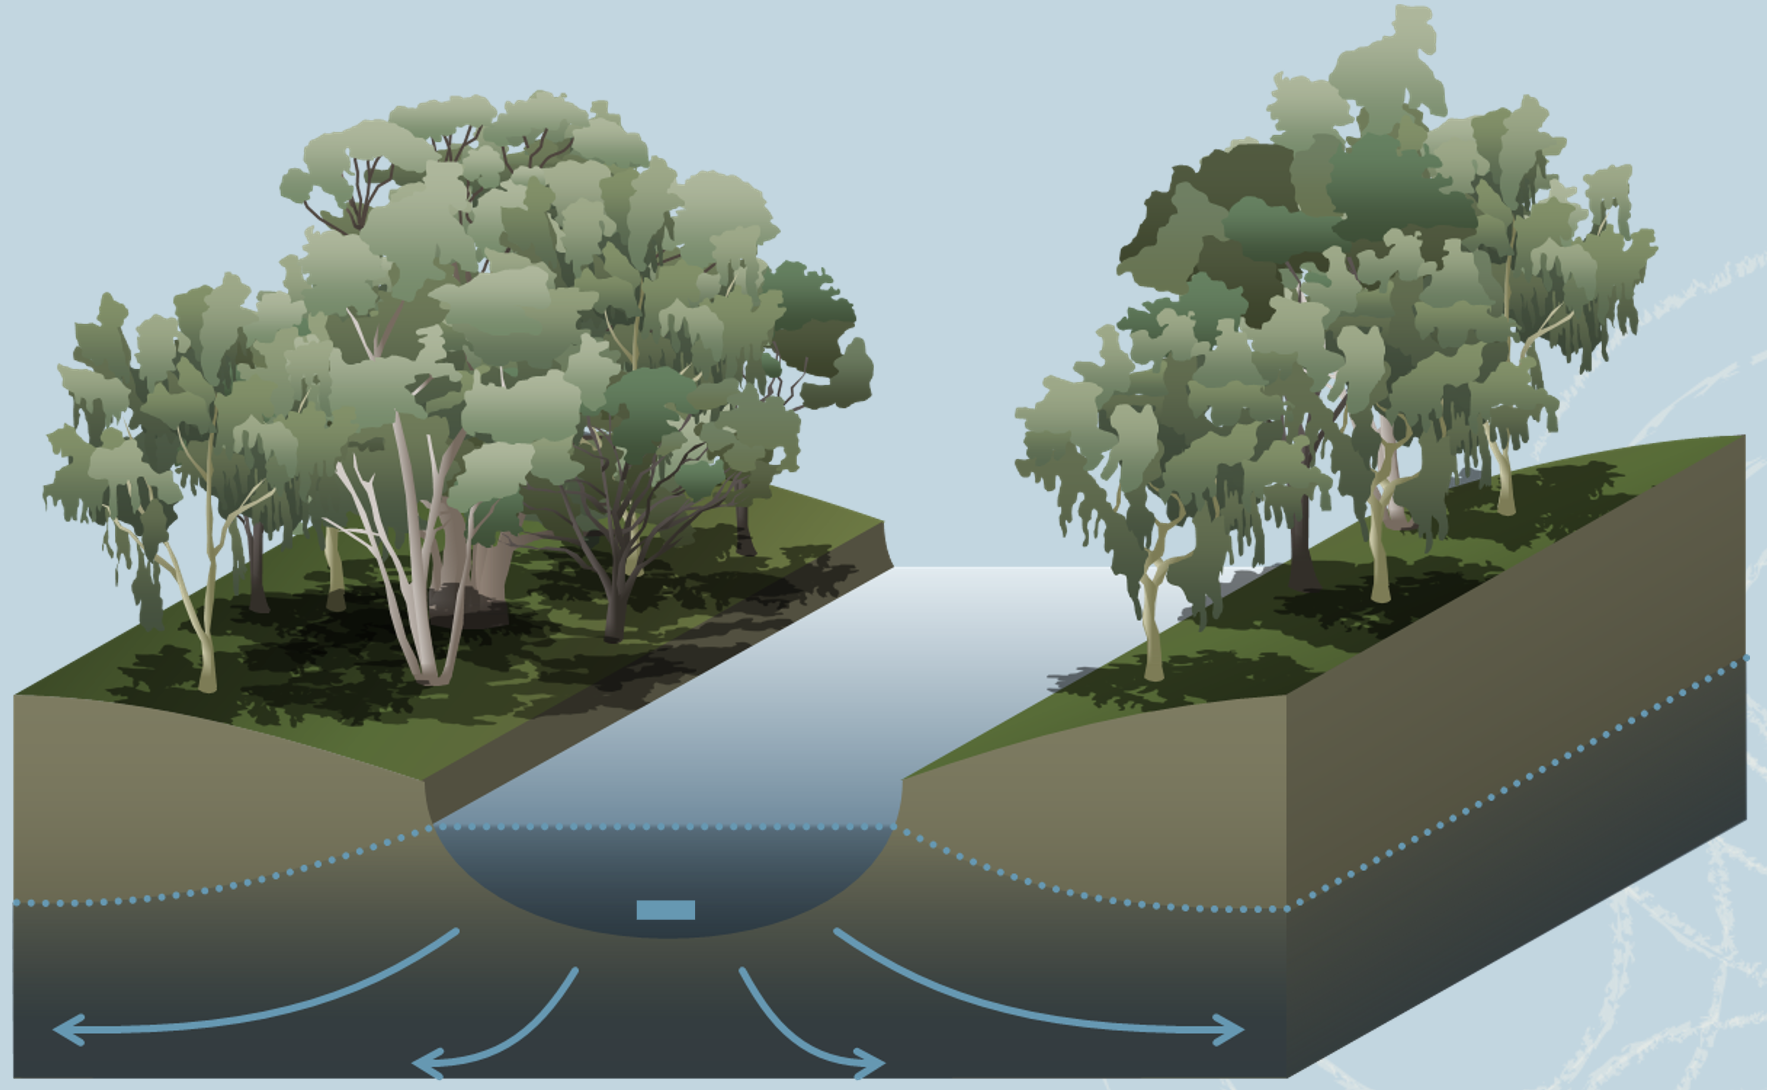
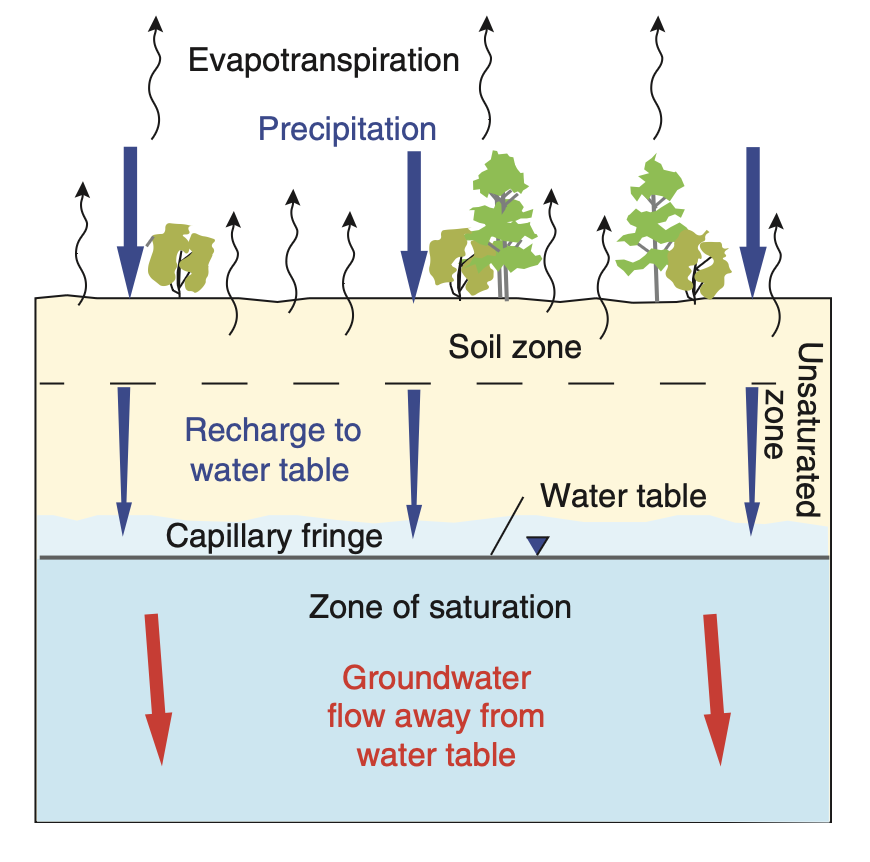
- Water in the subsurface occupies pores in soil and rock.
- Unsaturated zone: pores contain both air and water
- Water content fluctuates with infiltration and evapotranspiration
- Plants use this water
- Saturated zone: pores are fully water-filled — this is groundwater
- The water table separates the two zones
- A small portion of rain infiltrates deep enough to reach the water table → recharge
Water in the ground isn’t just “there”—it’s dynamic and layered.
Flow of Groundwater
- After recharge, groundwater flows:
- Downward from water table due to gravity
- Sideways following pressure gradients, often toward streams
- This flow forms discharge zones (e.g. rivers, springs)
- Example: Rain → infiltration → percolation → river discharge
- Timescales vary:
- Surface runoff = hours
- Groundwater discharge = months to years
- Flow influenced by:
- Water table shape
- Conductivity of subsurface materials
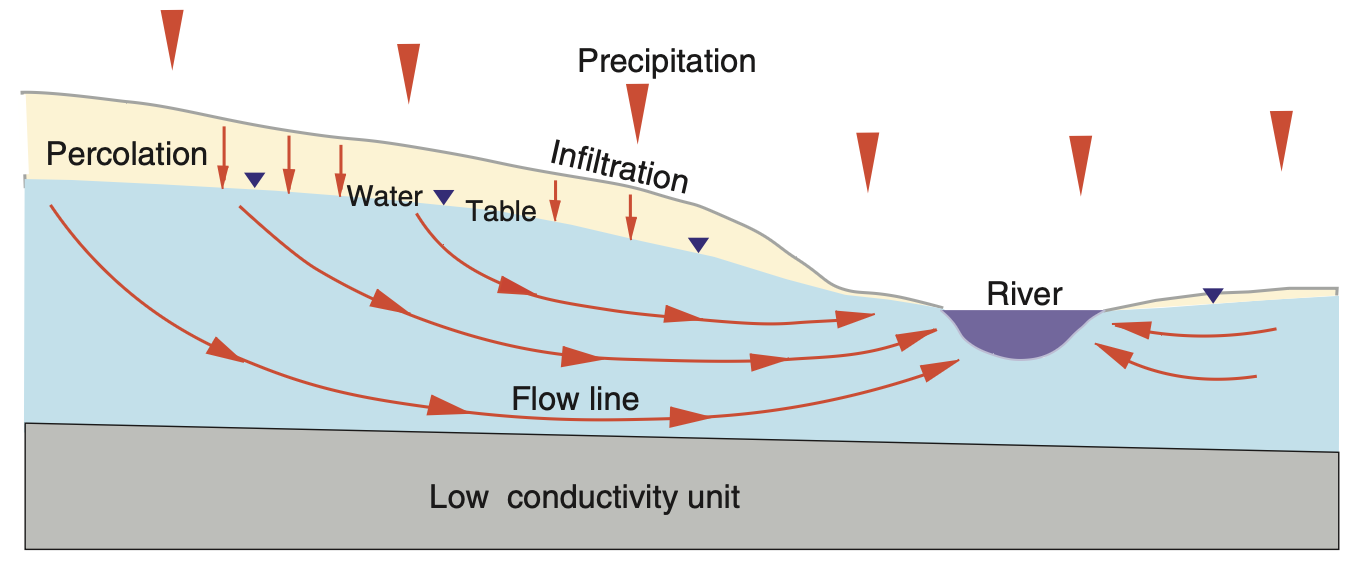
Flow is slow, deep, and essential to sustaining surface water.
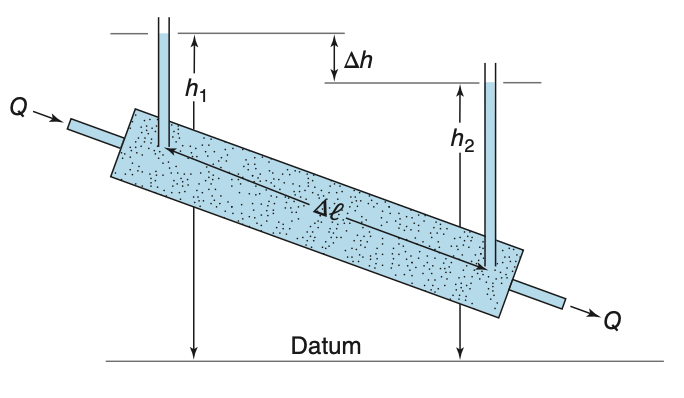
Groundwater flow in the lab
Darcy’s Law: The Foundations
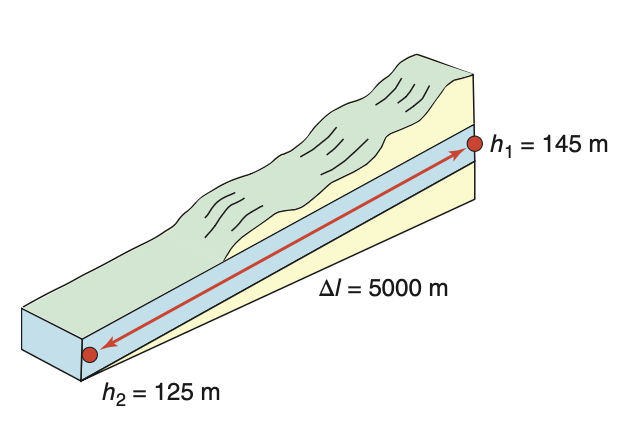
- Henry Darcy (1800s) studied water filtration and developed an empirical law for groundwater flow.
- Darcy’s experiments showed that flow depends on energy differences:
- Water moves from high to low gravitational energy
- Like a drop on a slide — higher up means more potential energy
- Energy loss over distance gives rise to the hydraulic gradient:
- This principle forms the core of Darcy’s Law.
Hydraulic Gradient and Energy Slope
- Gradient = energy change per unit length of flow path
- In groundwater terms:
- Energy is hydraulic head (gravitational + pressure)
- Steeper gradient → faster potential flow
- Flow rate increases with:
- Greater difference in head
- Shorter flow distance
- Key analogy: sliding down a playground slide
- Steeper slide → faster slide
The gradient controls the force pushing water through pores.

Hydraulic Conductivity
- Not all materials transmit water equally well.
- Hydraulic conductivity (
K ) quantifies this:- High
K → gravel, coarse sand - Low
K → clay, unfractured rock
- High
- Units: length per time (e.g. m/day)
K depends on:- Pore size and connectivity
- Fluid properties (viscosity, density)
Even with the same gradient, some materials flow better than others.
Darcy’s Equation
Darcy combined gradient (
i ) and material property (K ) to describe flow:q = -K i q : Darcy velocity (aka specific discharge), volumetric flow per area
Alternate form using cross-sectional area
A :Q = -K i A Negative sign: flow goes from high head to low head
Valid for laminar flow in porous media
Darcy’s Law is foundational to all groundwater flow modeling.

Linear (Pore) Velocity
Darcy velocity (
q ) assumes flow spreads over the whole cross section.But in reality, water only flows through connected pores
True or pore velocity (
v ) is:v = \frac{q}{n_e} where:
n_e : effective porosity (only connected pore space)q : Darcy velocity
Since
n_e < 1 , pore velocity is greater than Darcy velocityRearranged Darcy’s Law:
v = -\frac{K}{n_e} \cdot \frac{h_1 - h_2}{\Delta l}
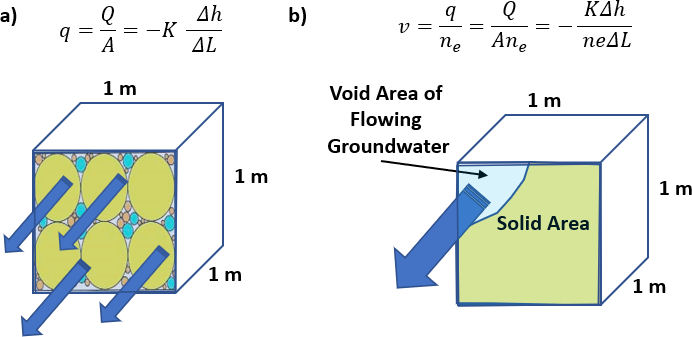
This gives the actual speed water travels through aquifers.
Components of Hydraulic Head
Hydraulic head is a measure of energy available to move groundwater
It is expressed in units of length (e.g., m above sea level)
In the field, head is measured with a standpipe or piezometer.
Key components:
- Elevation of top of casing (
EL_{TOC} ) - Depth to water (
DTW )
- Elevation of top of casing (
The head is calculated by:
h = EL_{TOC} - DTW
Measuring head tells us the direction and gradient of groundwater flow.
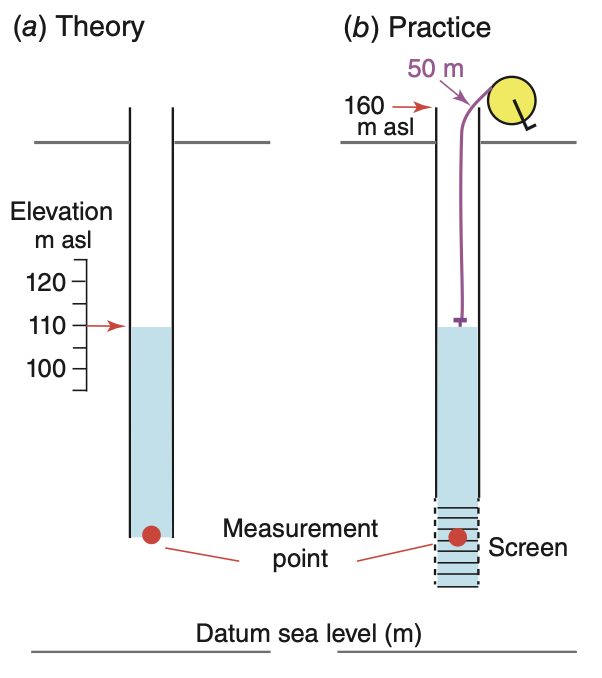
Components of Hydraulic Head II
Hydraulic head consists of:
- Elevation head (
z ): height above datum - Pressure head (
P/\rho_w g ): height of water column exerting pressure - Velocity head: often negligible in groundwater
- Elevation head (
General form (Bernoulli):
h = z + \frac{P}{\rho_w g} + \frac{v^2}{2g} Simplified form (no velocity term):
h = z + \frac{P}{\rho_w g} Units: meters (m), Pressure (Pa) can be converted from depth of water:
P = \rho_w g (h - z)
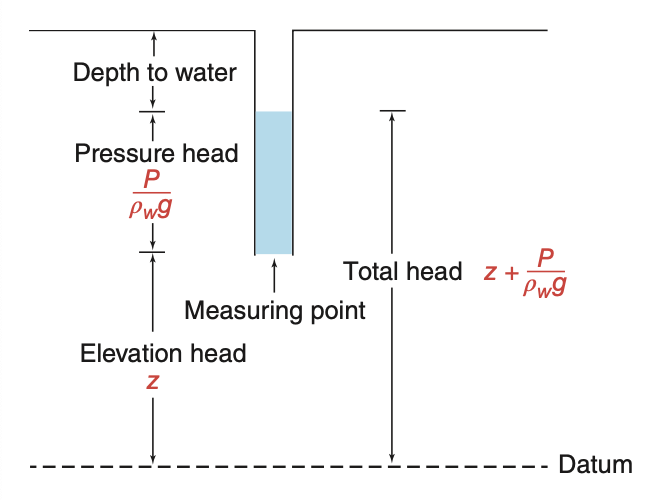
Hydraulic Conductivity
Hydraulic conductivity is a measure of how easily water flows through porous material
Denoted by
K , it appears in Darcy’s Law:q = -K \frac{dh}{dl} Units of
K are velocity (e.g. m/day)↑
K : sand, gravel, ↓K : clay, shaleK depends on:- Properties of the medium
- Properties of the fluid (density, viscosity)
Hydraulic conductivity is widely used in field hydrogeology.
Intrinsic permeability
k characterizes the medium only:- Independent of fluid type
- Units:
\mathrm{m}^2 , also expressed in darcy or cm²
Darcy’s Law rewritten:
q = -\frac{k \, \rho_w g}{\mu} \, \frac{dh}{dl} Conversion to hydraulic conductivity:
K = \frac{k \, \rho_w g}{\mu} At 20°C and 1 atm: $ K = 9.77 \times 10^6 \cdot k$
k = (1.023 ) \times 10^{-7} \, \mathrm{m \cdot sec} \cdot K
Use
Estimating Hydraulic Conductivity
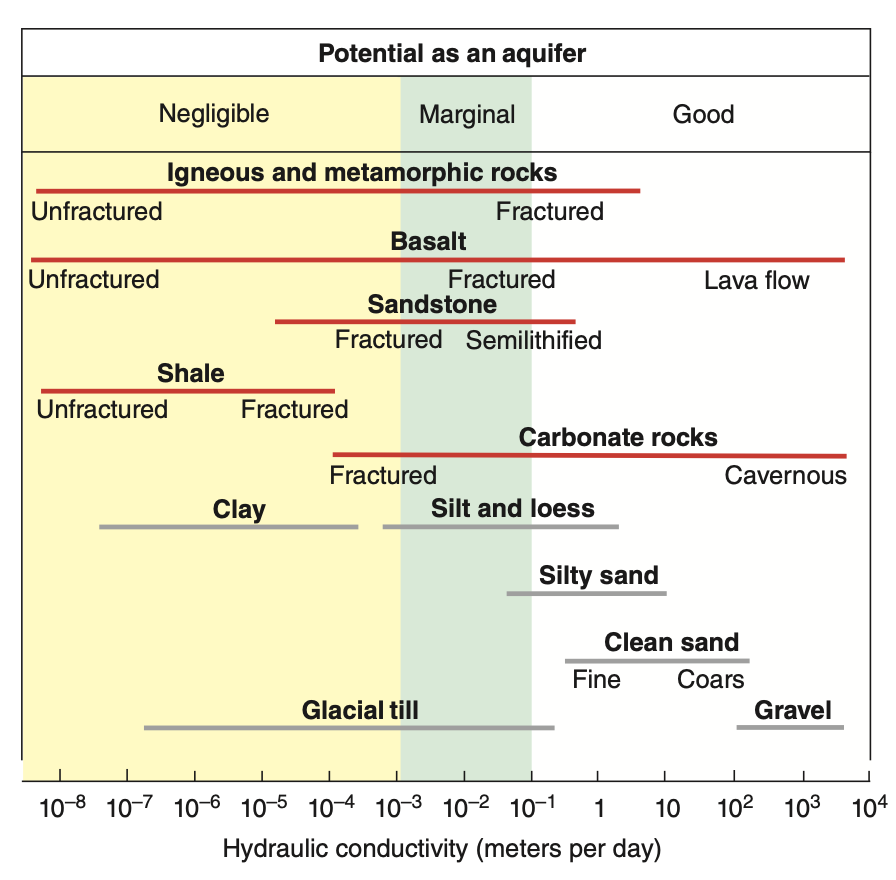
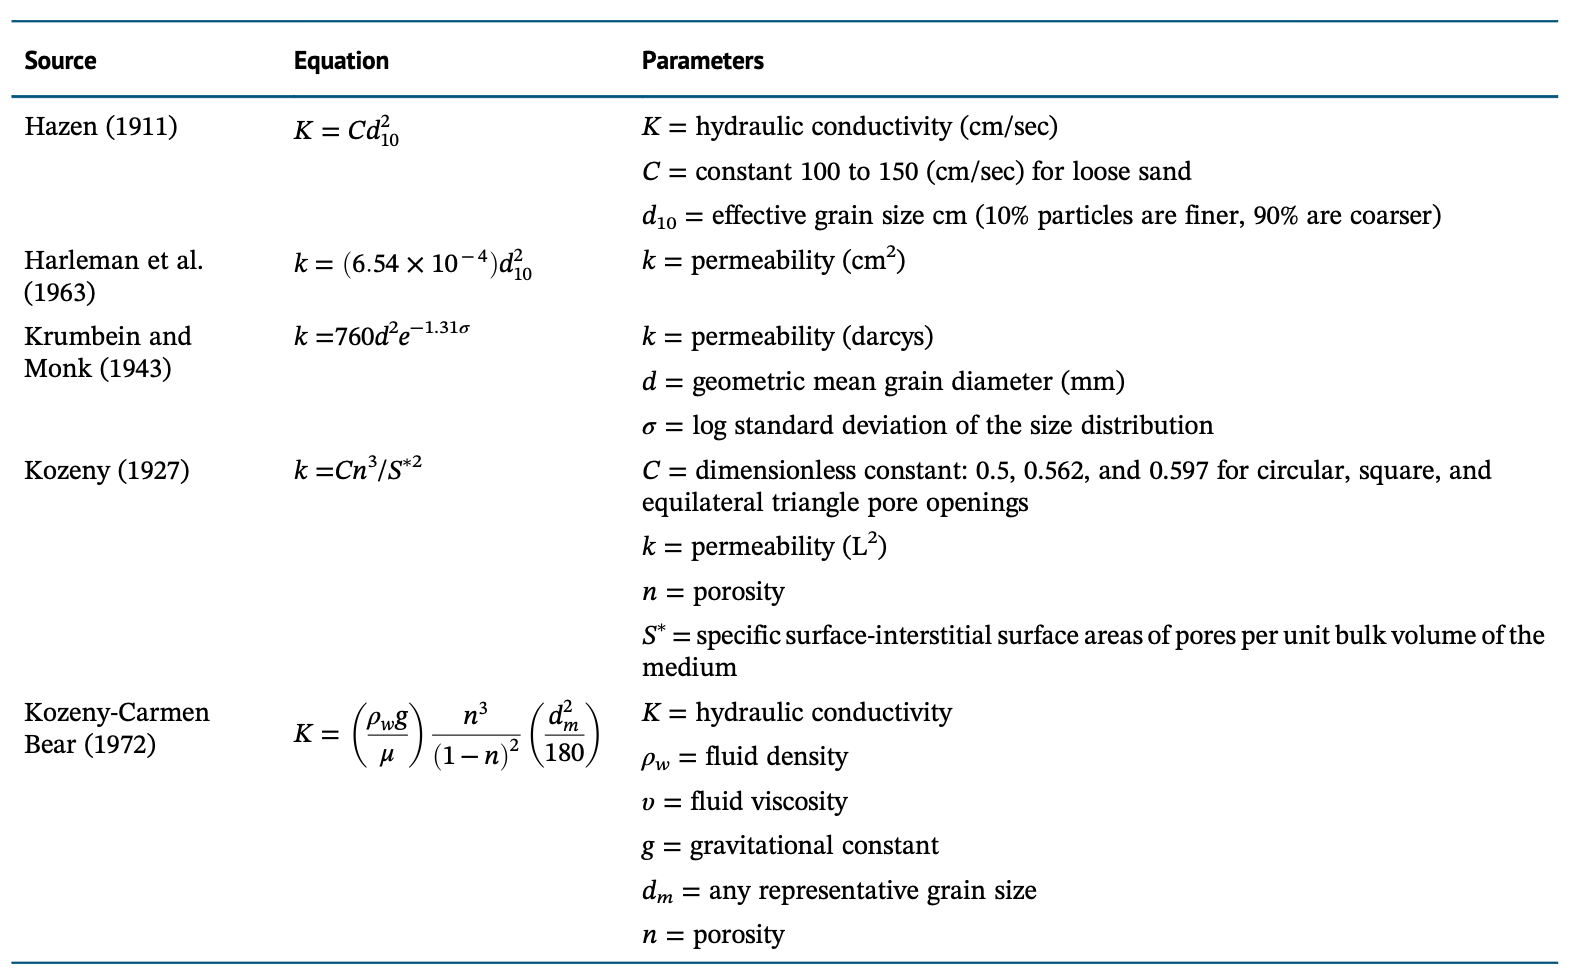
Experimental Determination of Hydraulic Conductivity
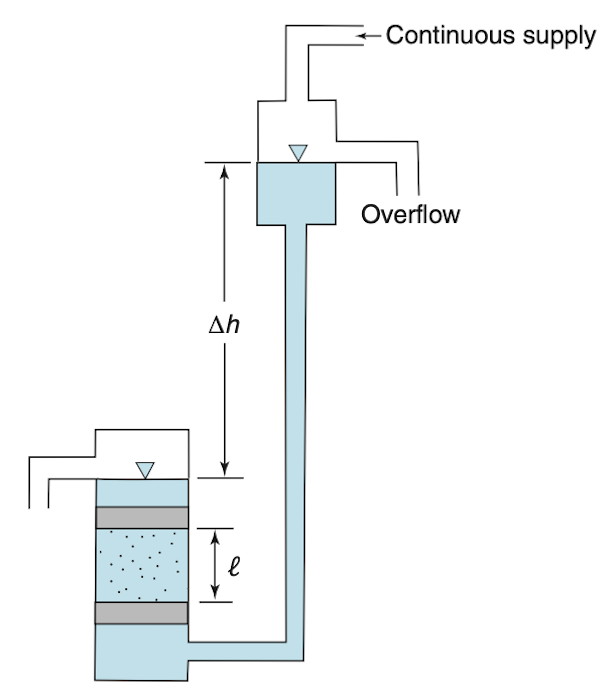
Constant-Head Test
- Used for coarse-grained materials (e.g. sands, gravels)
- A steady flow is established by maintaining a constant head difference across the sample
- Flow rate
Q is measured at the outlet - Hydraulic conductivity
K is calculated as:K = \frac{Q L}{A h} where:L = sample lengthA = cross-sectional areah = constant head difference
Works best when
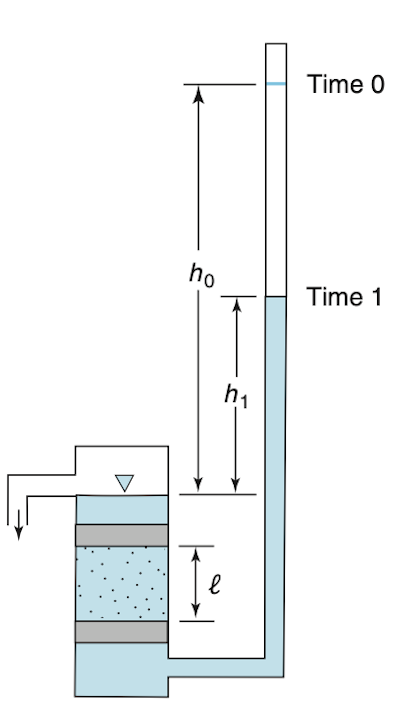
Experimental Determination of Hydraulic Conductivity
Falling-Head Test
- Preferred for fine-grained or less permeable materials (e.g. clays, silts)
- No continuous flow: water level in standpipe drops over time
- Measure time
t_1 - t_0 for water head to fall fromh_0 toh_1 - Hydraulic conductivity:
K = 2.3 \, \frac{a L}{A (t_1 - t_0)} \log_{10} \left( \frac{h_0}{h_1} \right) where:a = standpipe cross-sectionA = sample cross-section
Falling-head is more accurate for slow flows and low
Anisotropic Flow and Darcy’s Law
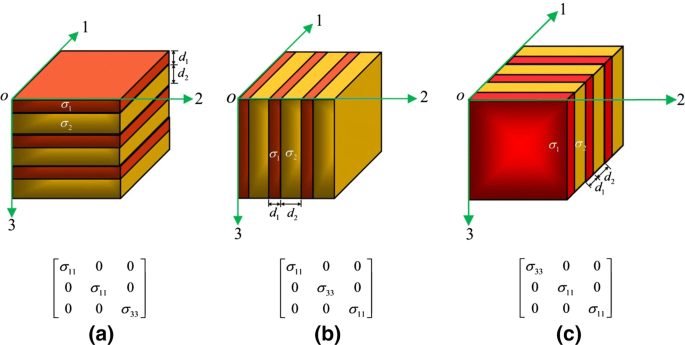
In anisotropic materials, hydraulic conductivity depends on direction.
Darcy’s Law becomes a vector-tensor equation:
\mathbf{q} = - \mathbf{K} \nabla h In Cartesian form:
\mathbf{q} = q_x \mathbf{i} + q_y \mathbf{j} + q_z \mathbf{k} \nabla h = \frac{\partial h}{\partial x} \mathbf{i} + \frac{\partial h}{\partial y} \mathbf{j} + \frac{\partial h}{\partial z} \mathbf{k} The hydraulic conductivity tensor is:
\mathbf{K} = \begin{bmatrix} K_{xx} & K_{xy} & K_{xz} \\ K_{yx} & K_{yy} & K_{yz} \\ K_{zx} & K_{zy} & K_{zz} \end{bmatrix}
These terms describe how flow in one direction may be influenced by gradients in others.
Darcy Velocity Components
- For anisotropic flow, each component of flow is influenced by multiple gradients:
- If the medium is aligned with coordinate axes, then off-diagonal terms vanish:
- This simplifies to:
This is common in layered sedimentary rocks where horizontal and vertical conductivities differ.
Anisotropy in Sedimentary Rocks
- Field and lab studies confirm many rocks are anisotropic
- Horizontal conductivity is often orders of magnitude greater than vertical
- This affects:
- Recharge and discharge zones
- Aquifer drawdown patterns
- Contaminant transport direction
Below are typical values from core samples:
Table – Anisotropic Conductivity of Sedimentary Rocks
| Material | Hydraulic conductivity (m/s) | Vertical conductivity (m/s) |
|---|---|---|
| Anhydrite | ||
| Chalk | ||
| Limestone, dolomite | ||
| Sandstone | ||
| Shale | ||
| Salt |
Heterogeneous Hydraulic Conductivity
A medium is homogeneous if permeability is constant within it.
If permeability varies across space, it is heterogeneous.
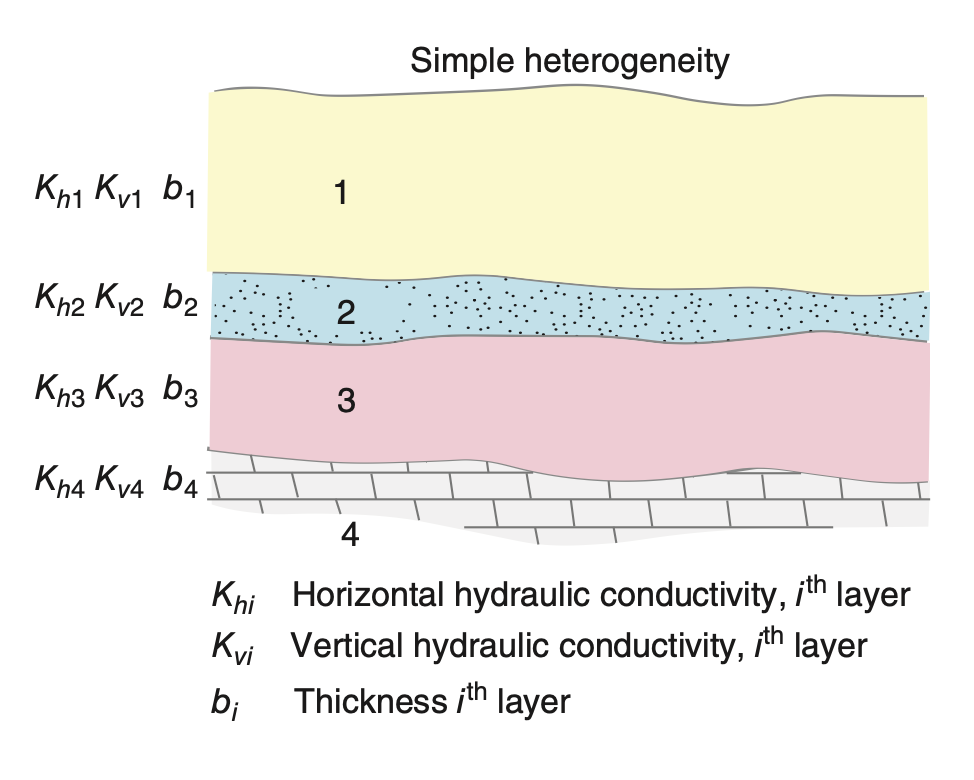
A common model: layered medium with different
K_{hi} ,K_{vi} , and thicknessesb_i For
M horizontal layers, the equivalent horizontal conductivity is:K_h = \frac{ \sum_{i=1}^M b_i K_{hi} }{ \sum_{i=1}^M b_i } This is a thickness-weighted average.
Horizontal conductivity dominates in flow parallel to bedding.
Vertical Flow and Flow Refraction
In vertical direction, equivalent conductivity is given by:
K_v = \frac{ \sum_{i=1}^M b_i }{ \sum_{i=1}^M \frac{b_i}{K_{vi}} } This is a harmonic average — low
K_{vi} dominates vertical resistance.When groundwater crosses a boundary between layers, it refracts.
Refraction law:
\frac{K_1}{K_2} = \frac{\tan(\alpha_1)}{\tan(\alpha_2)} The angle of flow changes based on contrast in hydraulic conductivity across boundary.

Investigating Groundwater Flow
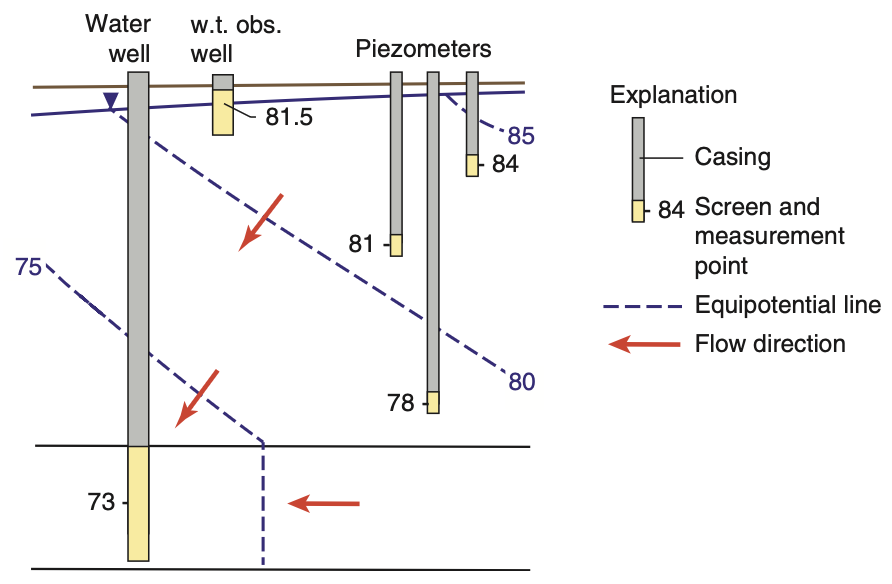
- Hydraulic head can be measured with:
- Water wells
- Piezometers
- Water table observation wells
- These are often installed together at study sites
- Example system: deep aquifer beneath shallow, low-permeability unit
- Flow is:
- Vertical in shallow layer
- Horizontal in deeper aquifer
Water Wells and Piezometers
Water wells:
- Large-diameter casings
- Long screens → integrate over large depth
- Used in well-defined aquifers
Measure average head where equipotential lines are vertical
In horizontal aquifer flow, screen depth doesn’t affect head reading
Piezometers:
- Narrow diameter
- Short screen → point-specific measurements
- Ideal for contamination, dewatering, or vertical gradient studies
- Often installed as nests at multiple depths
- Water well:
h = 73 m (deep) - Piezometers: show vertical gradient (e.g., 81 → 78 m)
 Wells, piezometers, and equipotential lines
Potentiometric Surface Maps
- Mapping the spatial distribution of hydraulic heads in an aquifer is a key method for evaluating aquifer conditions.
- A potentiometric surface map shows groundwater levels (hydraulic head) across an area.
- Important uses:
- Identifying recharge and discharge areas
- Detecting pumping impacts (cones of depression)
- Predicting contaminant migration paths
- Meinzer (1923): defined potentiometric surface as the imaginary surface representing groundwater head in an aquifer.
Steps to Create Potentiometric Maps
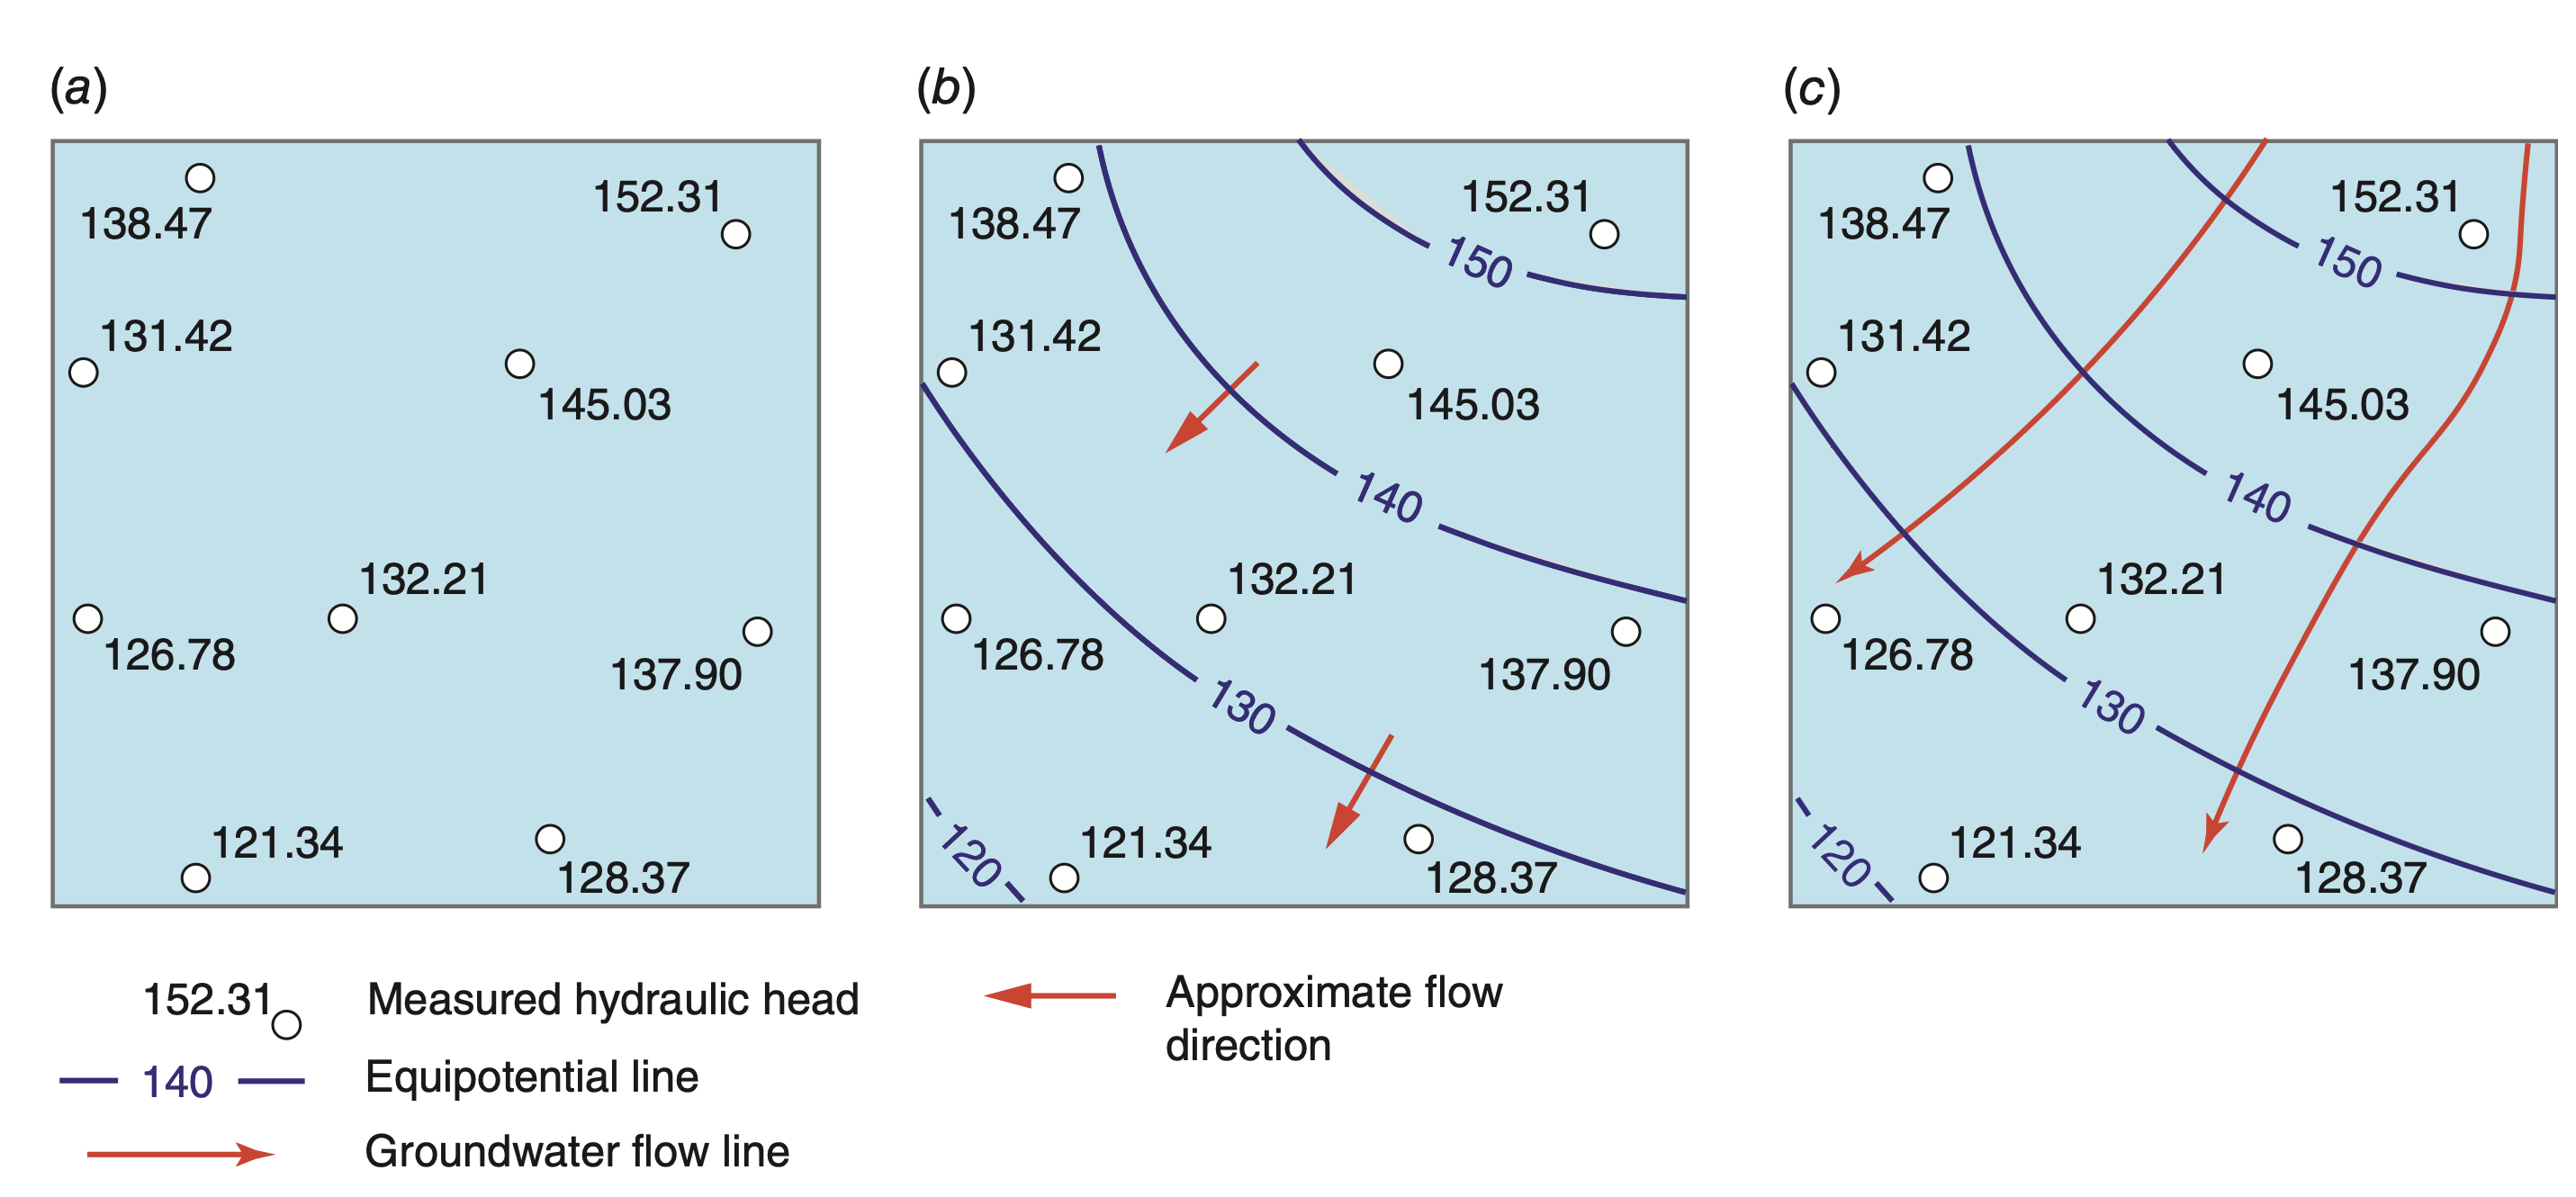
Three main steps:
- Plot points: map well/piezometer locations with measured head values
- Contour: draw equipotential lines connecting equal head values
- Flow arrows: add arrows perpendicular to equipotential lines (showing decreasing head)
Key notes:
- Map must be for one aquifer only
- Flow in aquifers is assumed horizontal
- Equipotential lines → vertical in cross-section, but projected to 2D on the map

Example: Memphis Aquifer
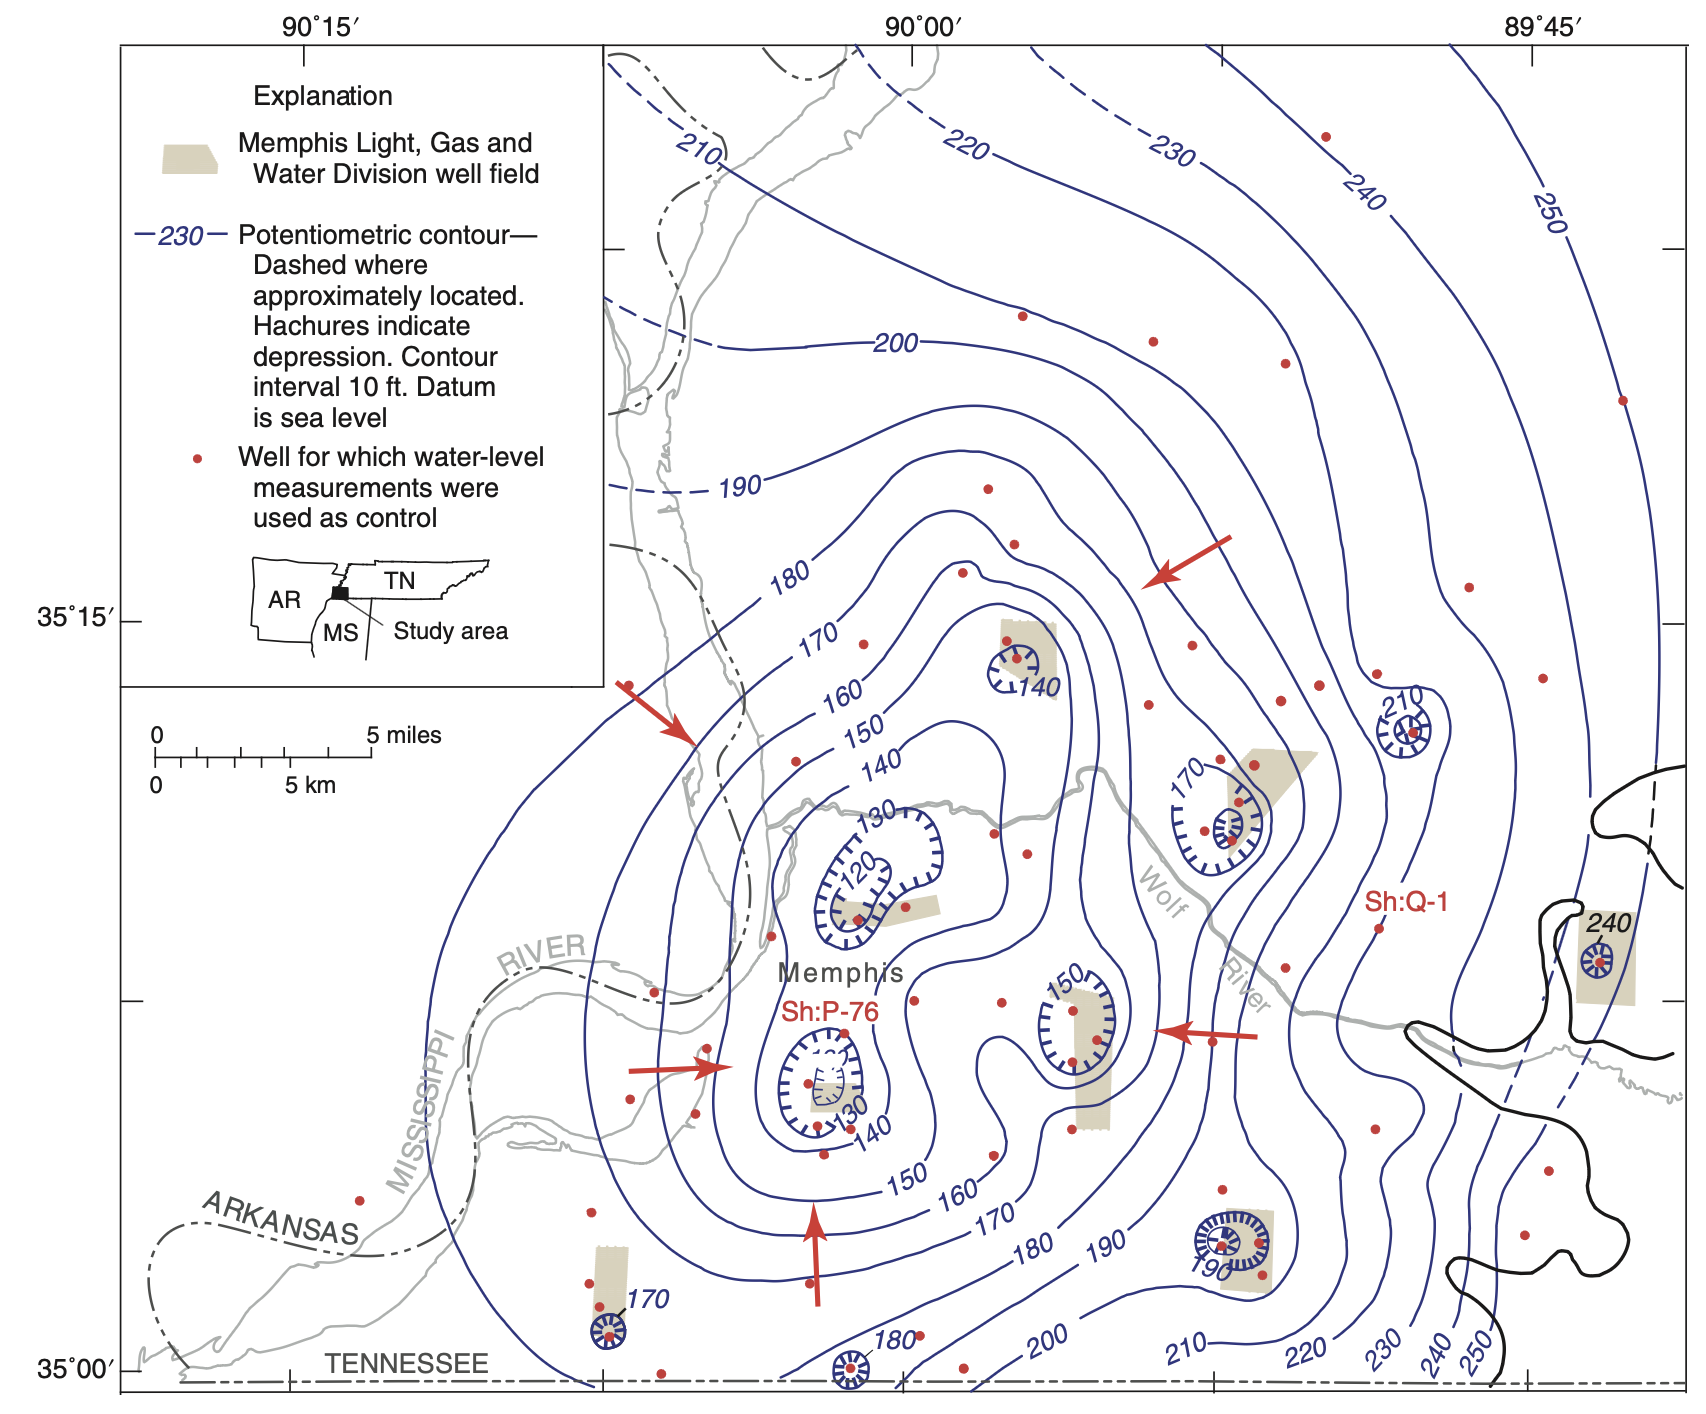
- Example: Memphis Sand Aquifer (1995)
- Heavy pumping caused cones of depression
- Equipotential contours + flow arrows show water moving toward pumping centers
- Applications:
- Tracking regional groundwater flow
- Managing water supply stress
- Identifying recovery trends after reduced pumping
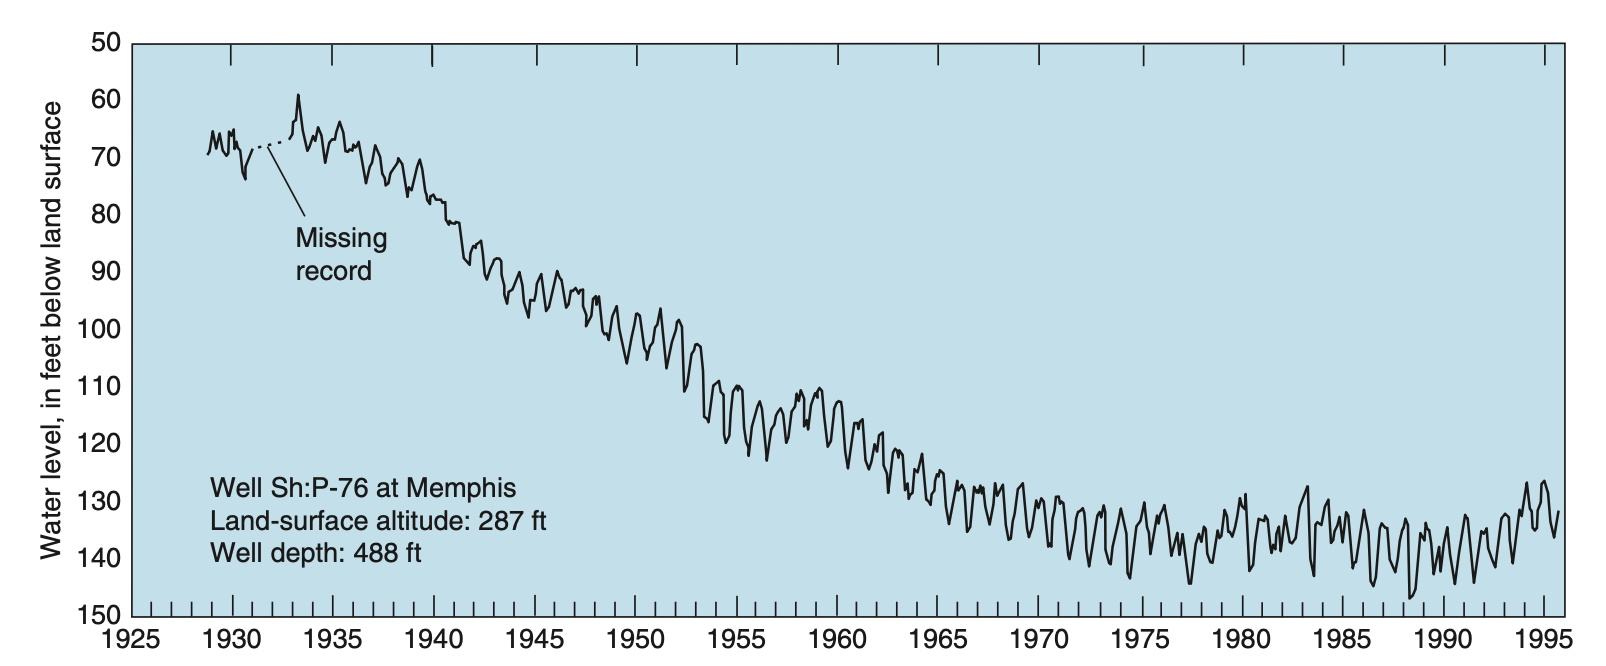
Water-Level Hydrographs
- A hydrograph shows groundwater levels over time at a monitoring well
- Traditionally: manual measurements (monthly, seasonal)
- Now: automated, remote sensors (satellite uplinks, wireless)
- Hydrographs complement potentiometric maps:
- Maps = snapshot at one time
- Hydrographs = long-term temporal trends
- Useful for:
- Detecting pumping impacts
- Seasonal recharge/discharge cycles
- Long-term aquifer depletion or recovery
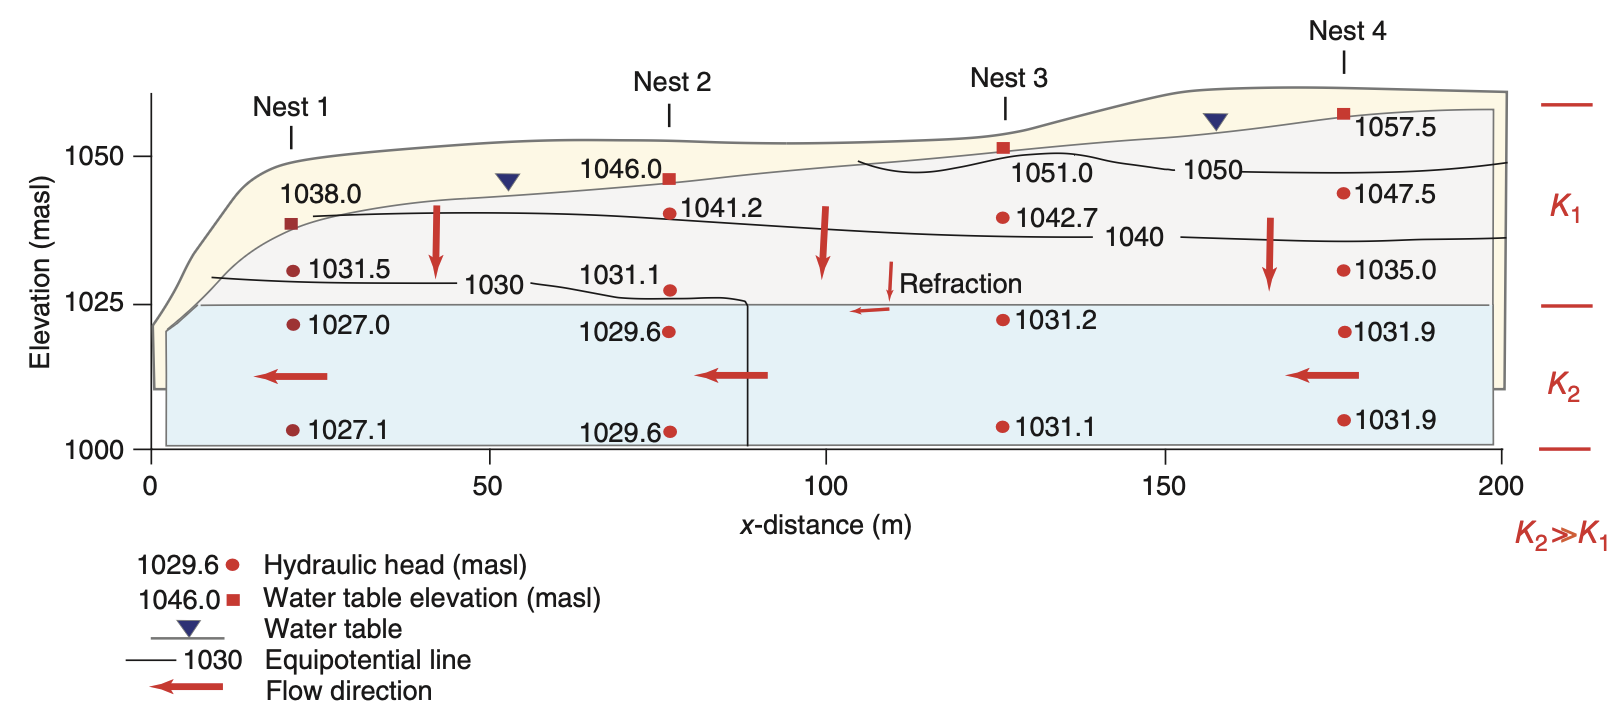
Hydrogeological Cross Sections
- Vertical sections through aquifers showing:
- Stratigraphy (layering,
K contrasts) - Hydraulic head distributions
- Flow lines and equipotentials
- Stratigraphy (layering,
- Often constructed along mean flow direction
- Show how layering causes refraction of flow paths
- Vertical exaggeration helps visualize layering and flow
What we learned
- We learned about the principles of groundwater flow, covering:
- Porosity and Physical Properties: void space in rocks and how it controls water storage
- Groundwater Occurrence: unsaturated vs saturated zones and the water table
- Darcy’s Law: the fundamental equation governing groundwater flow rates
- Hydraulic Properties: head, conductivity, and permeability measurements
- Heterogeneous Media: flow behavior in layered systems and flow refraction
- Field Investigation Methods: wells, piezometers, and mapping techniques
- Practical Applications: aquifer management and contaminant transport